

What KPIs do venture firms care about across stages?
Research on the top 10 startup metrics
Revenue, cash-on-hand, burn rate, and other metrics are well known and commonly requested by venture firms as they monitor portfolio companies. But how do these metrics change as companies mature through stages?
Do KPIs and reporting standards evolve as companies near an IPO or other exit?
Which metrics are critical and which are nice-to-have?
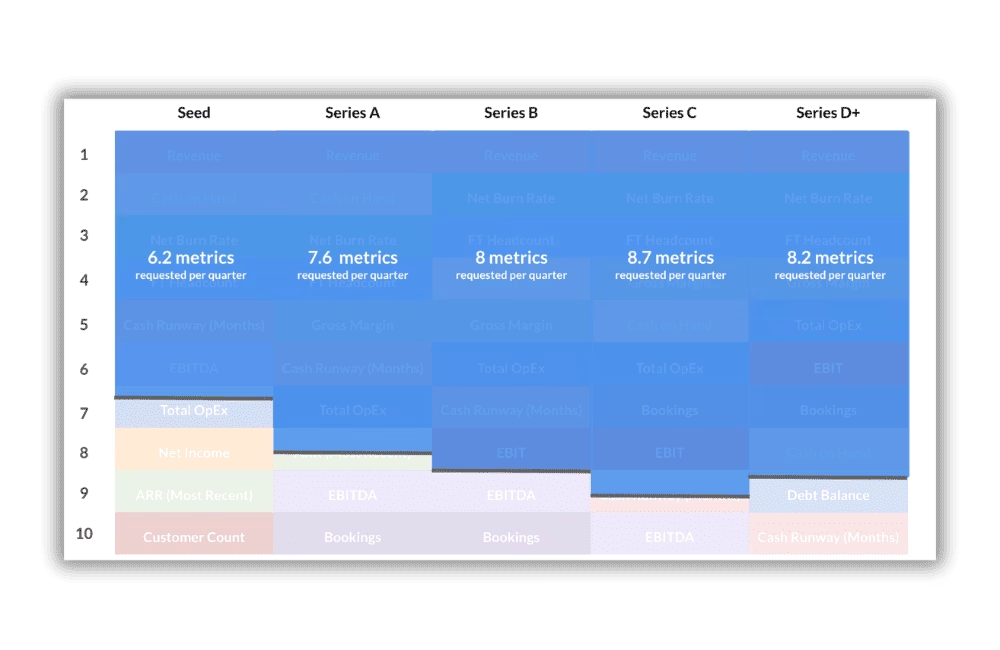
- Revenue, net burn rate, FT headcount, and gross margin are frequently requested
- Most venture firms request 6-9 metrics per quarter from each PortCo
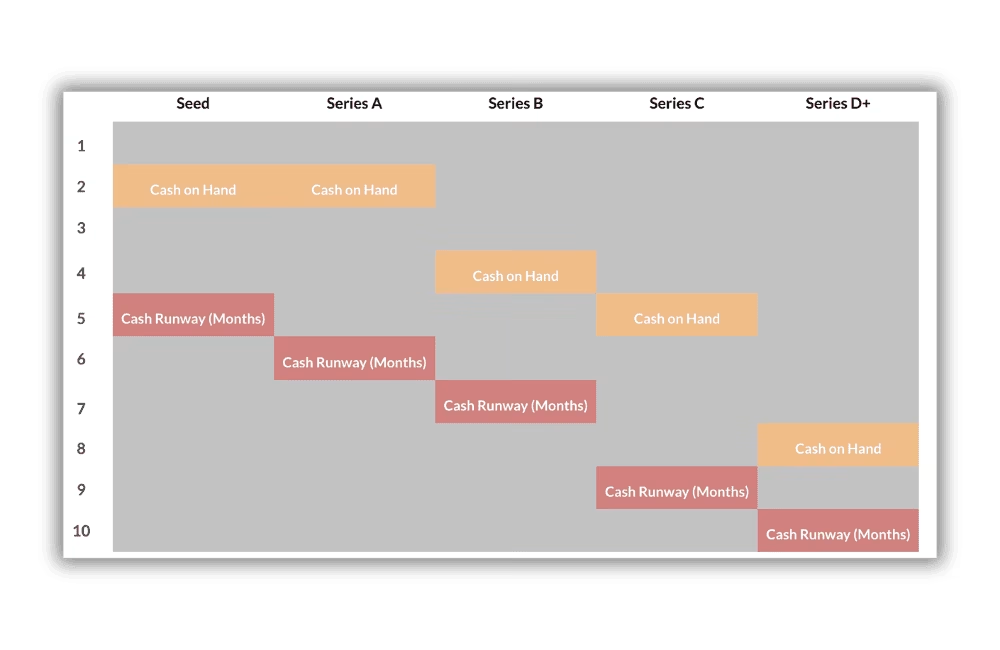
- Cash ranks high in early stages but becomes less critical in later stages
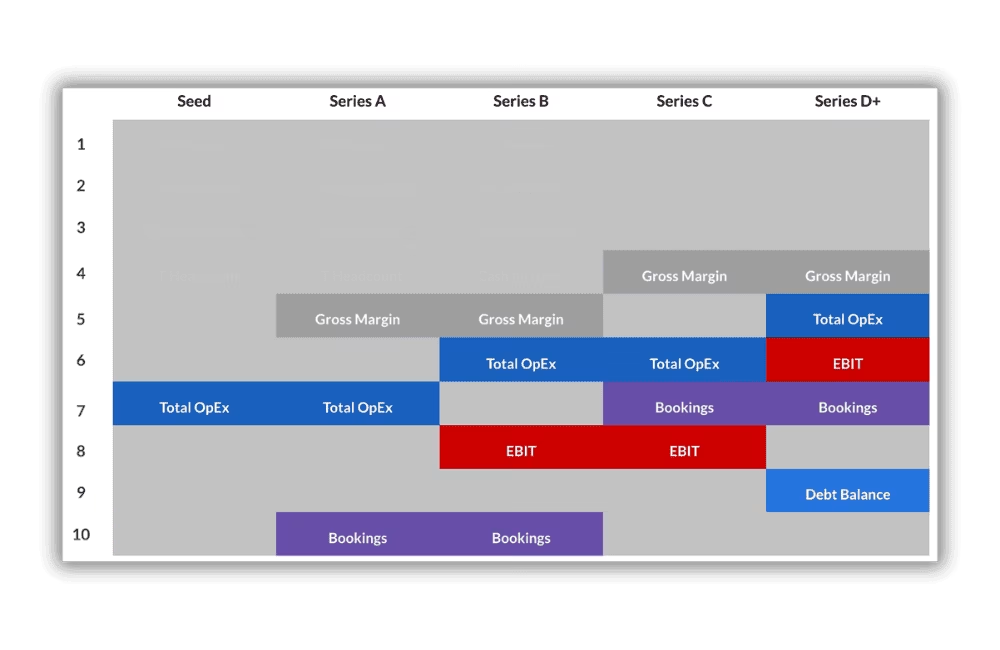
- Operational metrics take up 50% of the top ten list at Series D+
Check out some charts from research on over 10k startups from VCs.

If you are a startup fundraising from investors, you want to know what metrics investors will ask from you in the financial part of your pitch deck.
Aumni aggregated 10k+ data points across portfolio companies across stages to create a consolidated view of the trends they see with requested performance metrics.
The average VC firm asks for 6-9 metrics from their PortCos quarterly.
Where in the top ten list a metric falls is moderately useful to understand what is most representative of PortCo performance and thus provided to GPs.
Top 10 most VC requested metrics by series stage
The key takeaways are:
- Revenue (not just ARR) is always asked for. I would have presumed top-of-the-funnel metrics such as “customer count” would matter at seed?
- Blowing cash is always important. Cash on hand / Net burn rate /FT headcount are core. Gross margin increases in import
- EBITDA being on the list for seed is baffling to me? I wouldn’t ask till S-C personally (depending!), right? Furthermore, there is EBIT and EBITDA!? This is so strange as the “DA” only matters if there are a lot of hardware startups included?
- I find some of Seed strange given the sole inclusion of Net Income. I’m guessing this is just to see how founders think about how the business will work in theory
- Total OpEX increasing in the rankings clearly makes sense over stages. I sort of think they should remove KPIs such as Revenue, but it depends on how you think the survey was done
- Bookings clearly imply that startups focus more on enterprise customers over time (which makes sense)
NOTE: Check out this blog if you want to “Understand top line SaaS revenue terms” and you can download an Excel tool here which has the math in it (free!).
The chart shows a summary of metrics collected by stage in order:
Metrics requested by venture capital investors
Despite concentration in the top 5 metrics, the 6-10 positions change in composition and order for each series (but not always for logical reasons).
In the sample, the average venture firm asks for 6-9 metrics from their PortCos every quarter to optimize for response rate and to best align with performance for that stage.
Take this with a pinch of salt as it makes zero sense for series-D investors ask for fewer metrics at S-D vs S-C (my guess is the n in the dataset).
See the chart below for the number of metrics collected by stage:
Cash and runway get asked less over time
Runway metrics are closely related here:
- Cash on hand: Makes sense when put in terms of months left alive
- Net burn rate: You can also do on gross basis. Get a free tool which cover gross and net burn here in the Runway Calculator Tool here
- Cash runway (months): Cash divided by burn rate
The two cash metrics in the top ten list (cash-on-hand and cash runway) are requested far less often across stages.
Both metrics fell from an average combined ranking of 3.5 out of 10 in seed stage to scarcely staying in the top ten by Series D+.
Aumni believes this is likely a natural trend as portfolio companies mature and liquidity and operating runway become less of an ongoing concern. Audits and more in-depth financial reporting requirements at later stages provide additional insights to cash management as well, thus decreasing the criticality and frequency of cash metric requests.
FML, that is dull to read. Simply put, my guess is that as investors are investing more wonga they are doing the math on how long cash will last!
Operational efficiency metrics rise in later stages
Metrics that focus on operational efficiency are requested more frequently later in the startup lifecycle.
If the metrics were reset to what metrics become important at each stage these would be at the top (beyond what any investor wants to see immediately anyway!).
50% of the top ten list in Series D+ are operational metrics compared to an average of 20% in Seed and Series A.
Gross margin, total OpEx, EBIT, bookings, and debt balance all become a frequently requested metric as companies enter growth and exit stages.
Aumni see a trend for late-stage operational efficiency metrics and reporting to matter as average check sizes for Series D+ companies have fallen significantly and late-stage exit events face higher hurdles.
I’m sure it was hard to do this analysis which is why they didn’t comment on EBIT vs EBITDA…
Data source
I rewrote this from a blog from Aumni. I’m just off a plane so pushed out a blog and used theirs as a basis.
Data Footnote:
- N=10,128 unique data points
- Representing the fiscal years 2020-2024
- Data includes quarterly collection/extraction only and includes completed and non-completed portfolio company responses
Conclusion
I personally think the value of this blog is just to see the metrics that investors have said they care about. I would NOT obsess about the rankings of the metrics as they’re so hard to summarise in a table that everyone loves to see and clout chasers want to share on LinkedIN.
If you are new to raising and/or investor reporting these will be useful for you to fathom WTF venture capital and growth investors want to see.
Building a startup sucks, so keep hustlin’! If you need to book a call with me, I might help you focus on what matters to unburden you.









Comments (0)
There are no comments yet :(